Lighthouse description
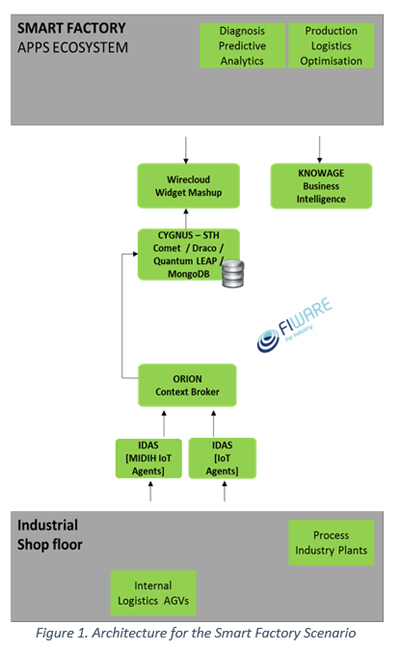
The main objective for this experiment has been the improvement of the efficiency and quality of critical production processes in FCA, implementing and using MIDIH solution that, by mean of FIWARE components, allows a better knowledge and understanding of events that can happen during the production of vehicles.
The adoption of this solution allowed a real-time monitoring of process parameters, in order to detect unexpected behavior, and to enable a predictive maintenance, thanks to the usage of data analysis algorithms.
FROM CHALLENGE TO SOLUTION
- CHALLENGE:
Production industries are sometimes characterized by a low level of information regarding the process quality and possible unexpected events that can occur (i.e. machine malfunctions).
In the AS-IS situation, even by using sensor systems and the related IT infrastructure, there was a lack of additional knowledge about the process, regarding for example parameters’ trends, and of data analytics tools. This can bring to quality issues, needs for unplanned maintenance intervention or production rescheduling, causing sometimes also line stops, with a negative impact on process quality and efficiency.
- SOLUTION (Main results expected to be achieved):
The adoption of MIDIH solution allowsed the creation of knowledge about what happens in industrial processes, thanks to the retrieval, monitoring and analysis of large amount of data.
The data detected are sent to the MIDIH Open Platform, enabling:
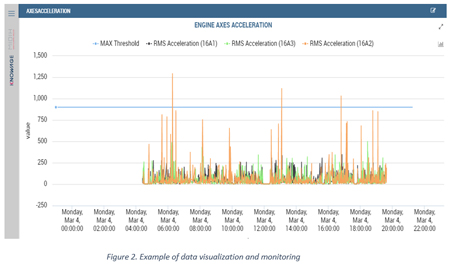
- The visualization of data, with different type of graphics, depending on the parameters that need to be monitored.
- The monitoring of the data, giving information on the parameters related to the status of the machinery and robots (i.e. vibrations), in order to check if their values are within the defined thresholds, to compare and correlate their trends and act in advance when needed.
- The prediction of events, thanks to the implementation of data analysis algorithms allowing to understand in advance the occurring of possible issues that can affect the process quality or efficiency.
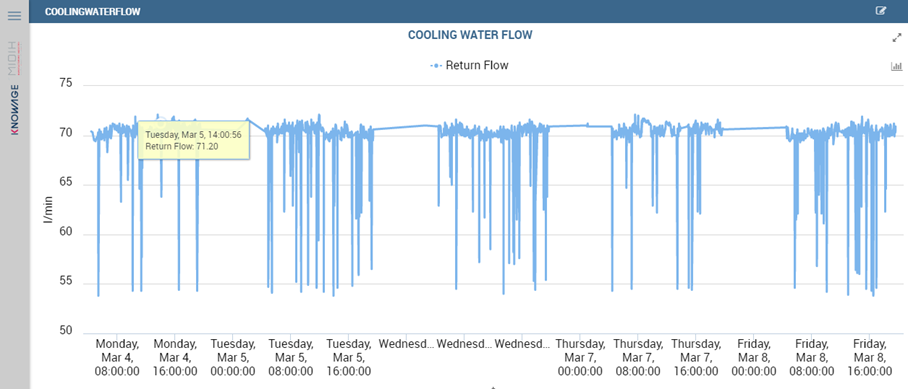 Figure 2 - Water flow capacity data visualization
Thanks to these functionalities, the user is able to contextualize, understand and apply results for a better decision making. Thanks to that It has been possible to strengthen the knowledge about the processes and better manage problems in production, avoiding low-quality products, line stops and rescheduling.
This brought to the optimization of the whole production process, in terms of productivity, energy and material consumptions and final costs.